Model Graphs
Visualize your model
Supported Frameworks
We currently support PyTorch and Lightning.
mlop supports logging model details to visualize the model architecture, including layers, connections, parameters, and more.
Logging Model Details
Currently, mlop supports directly invoking mlop.watch() on a model to log the model graph.
Data Flow
In PyTorch/Lightning, model details are recorded by tracing the autograd function across every module in the model. This is done once upon initialization. The first iteration of the model will be used to record the data flow and tree structure of the model.
Disabling Data Flow Logging
In certain models, the autograd functions injected may affect the ability to save onnx models. In this case, you can disable data flow logging by settingdisable_graph=True.
Example
This provides you with nice visualization as soon as the model training starts,
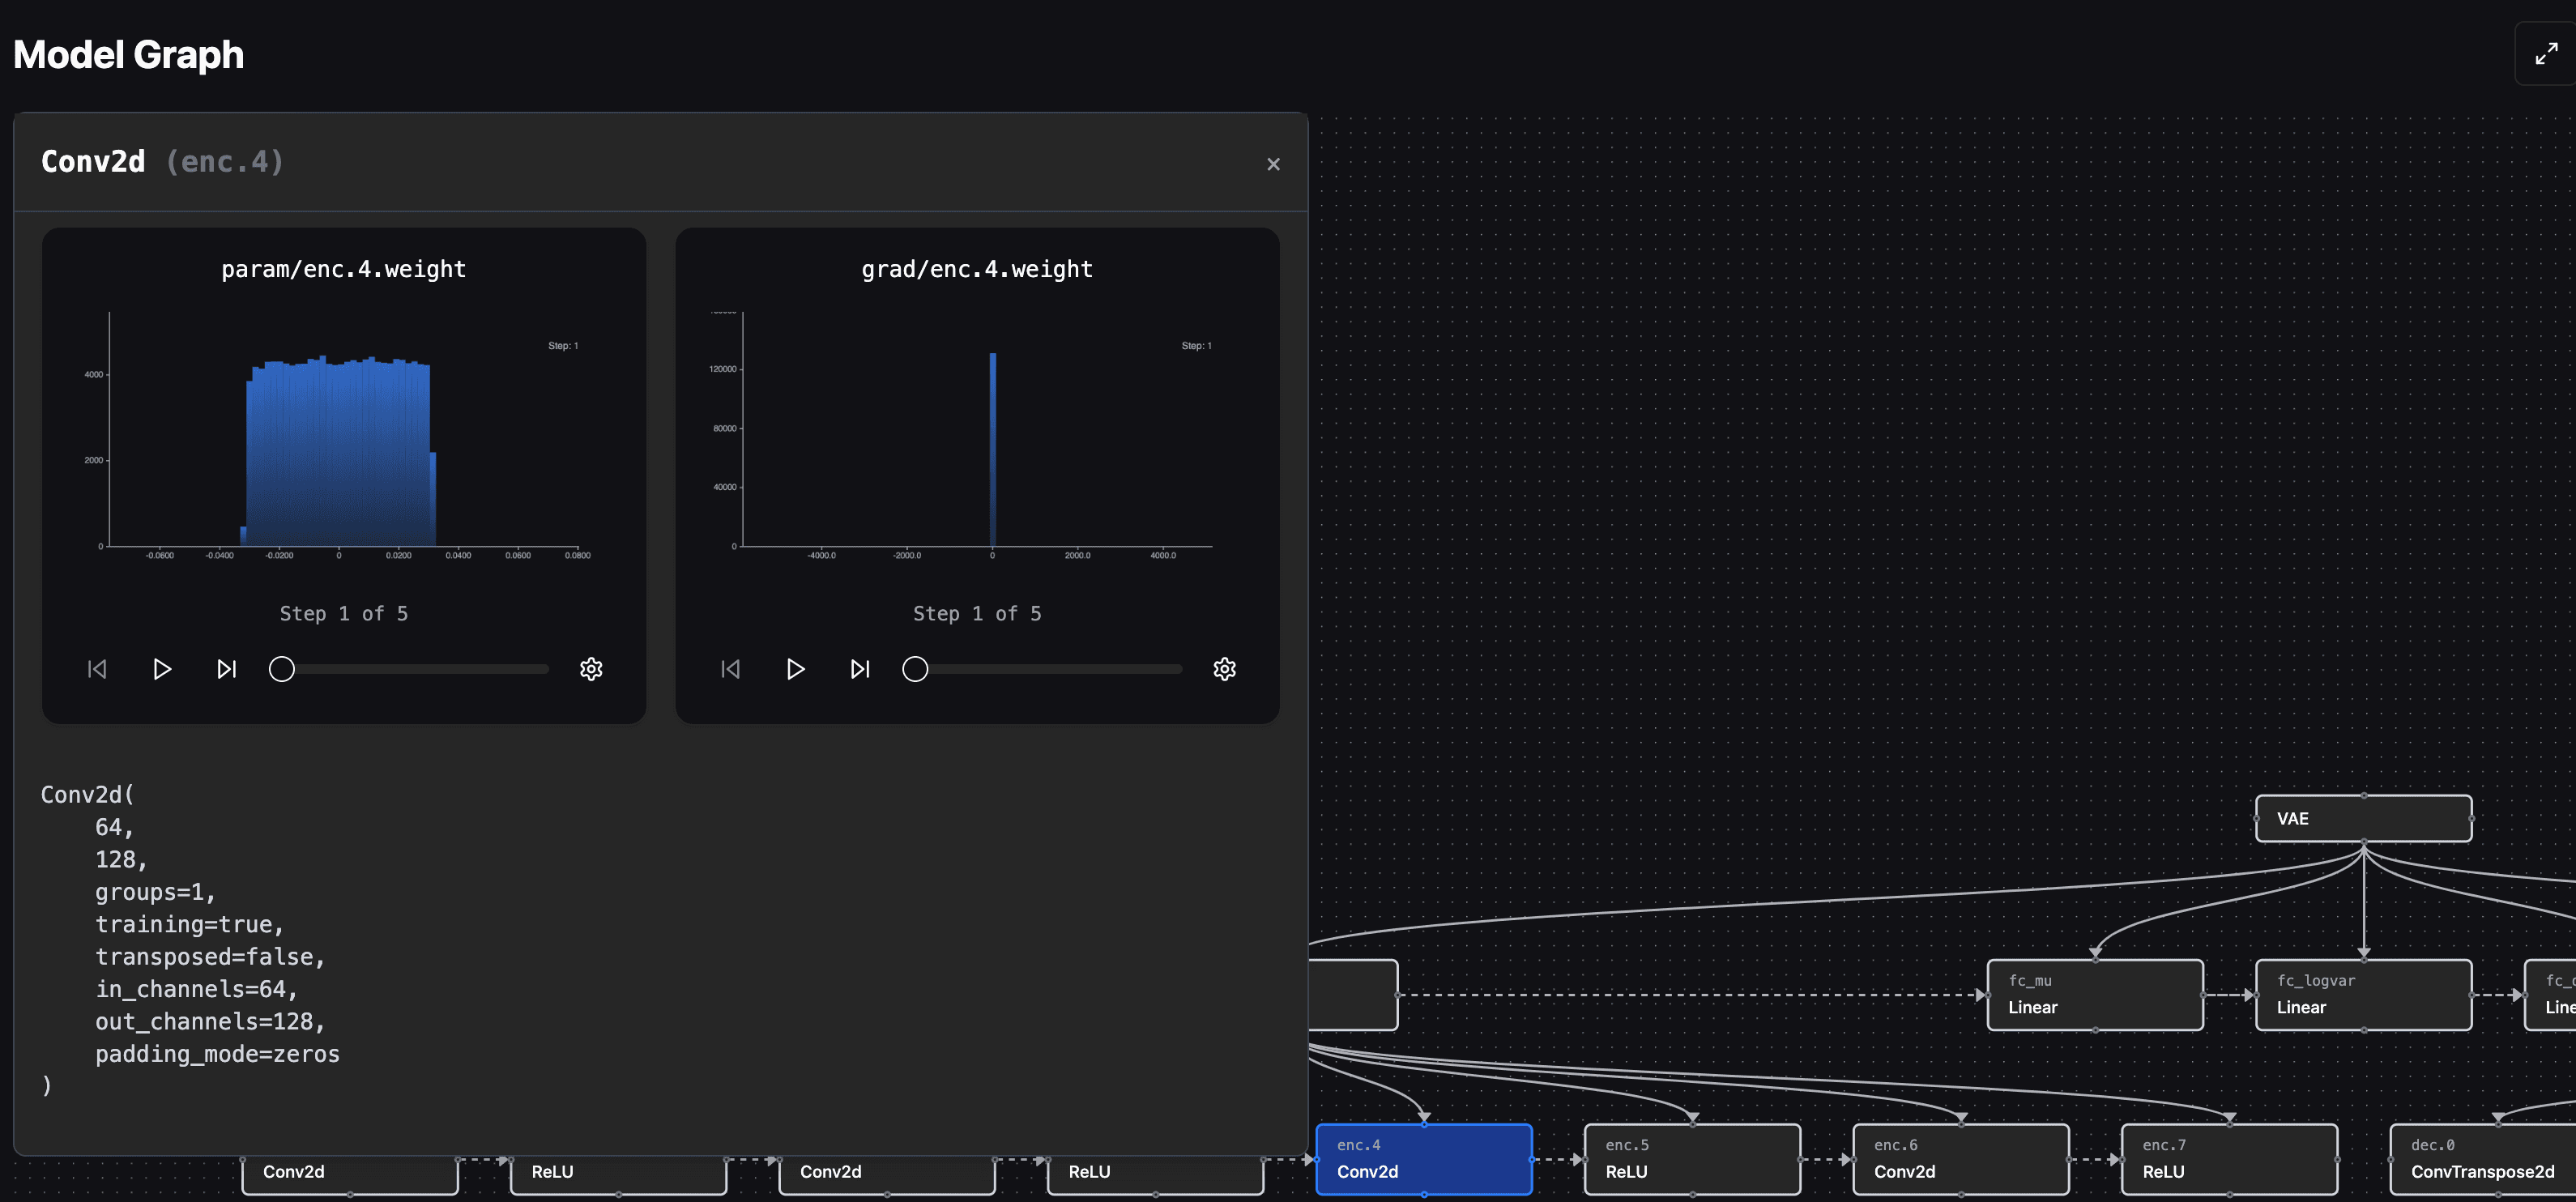
Visualizing PyTorch/Lightning Models
For each node, mlop can log the following details for both the input and the output:
- Name
- Type
- Position
- Shape
- Parameters
- Connections