Line Graph
Visualize your metrics as a line graph
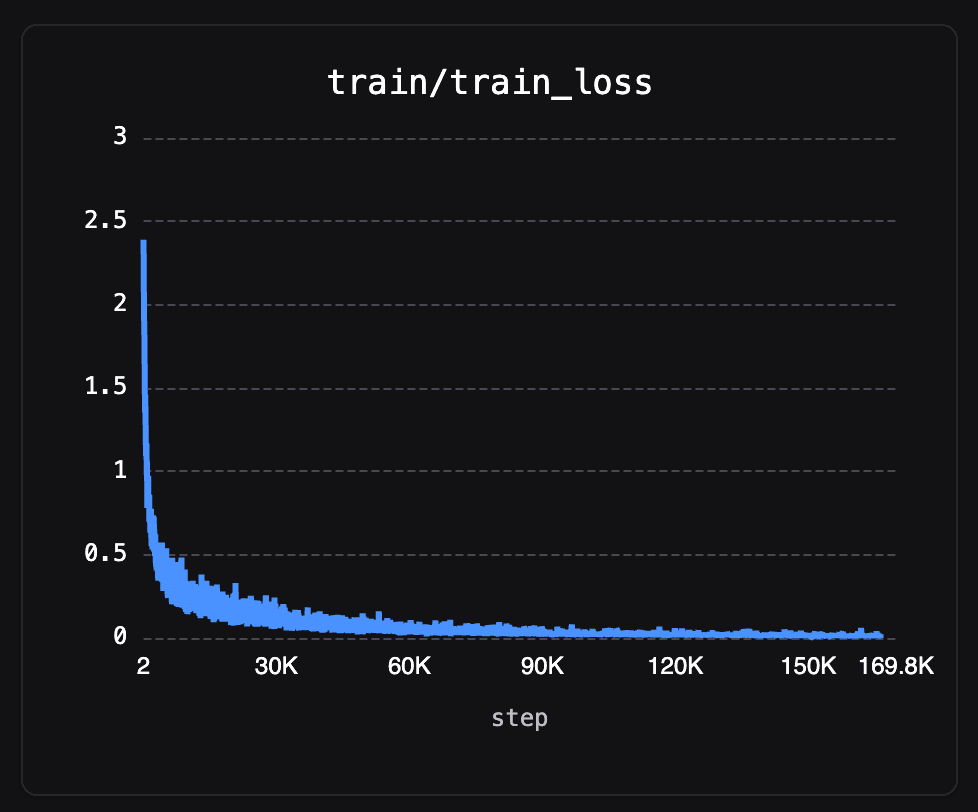
When logging numerical data using .log
mlop will automatically generate line graphs of this numerical metric over time, which will look something like
Supported Formats
By default, mlop supports logging anything of the type float, int, or torch.Tensor with a single dimension, as well as arrays of such.