Images
Visualize your images
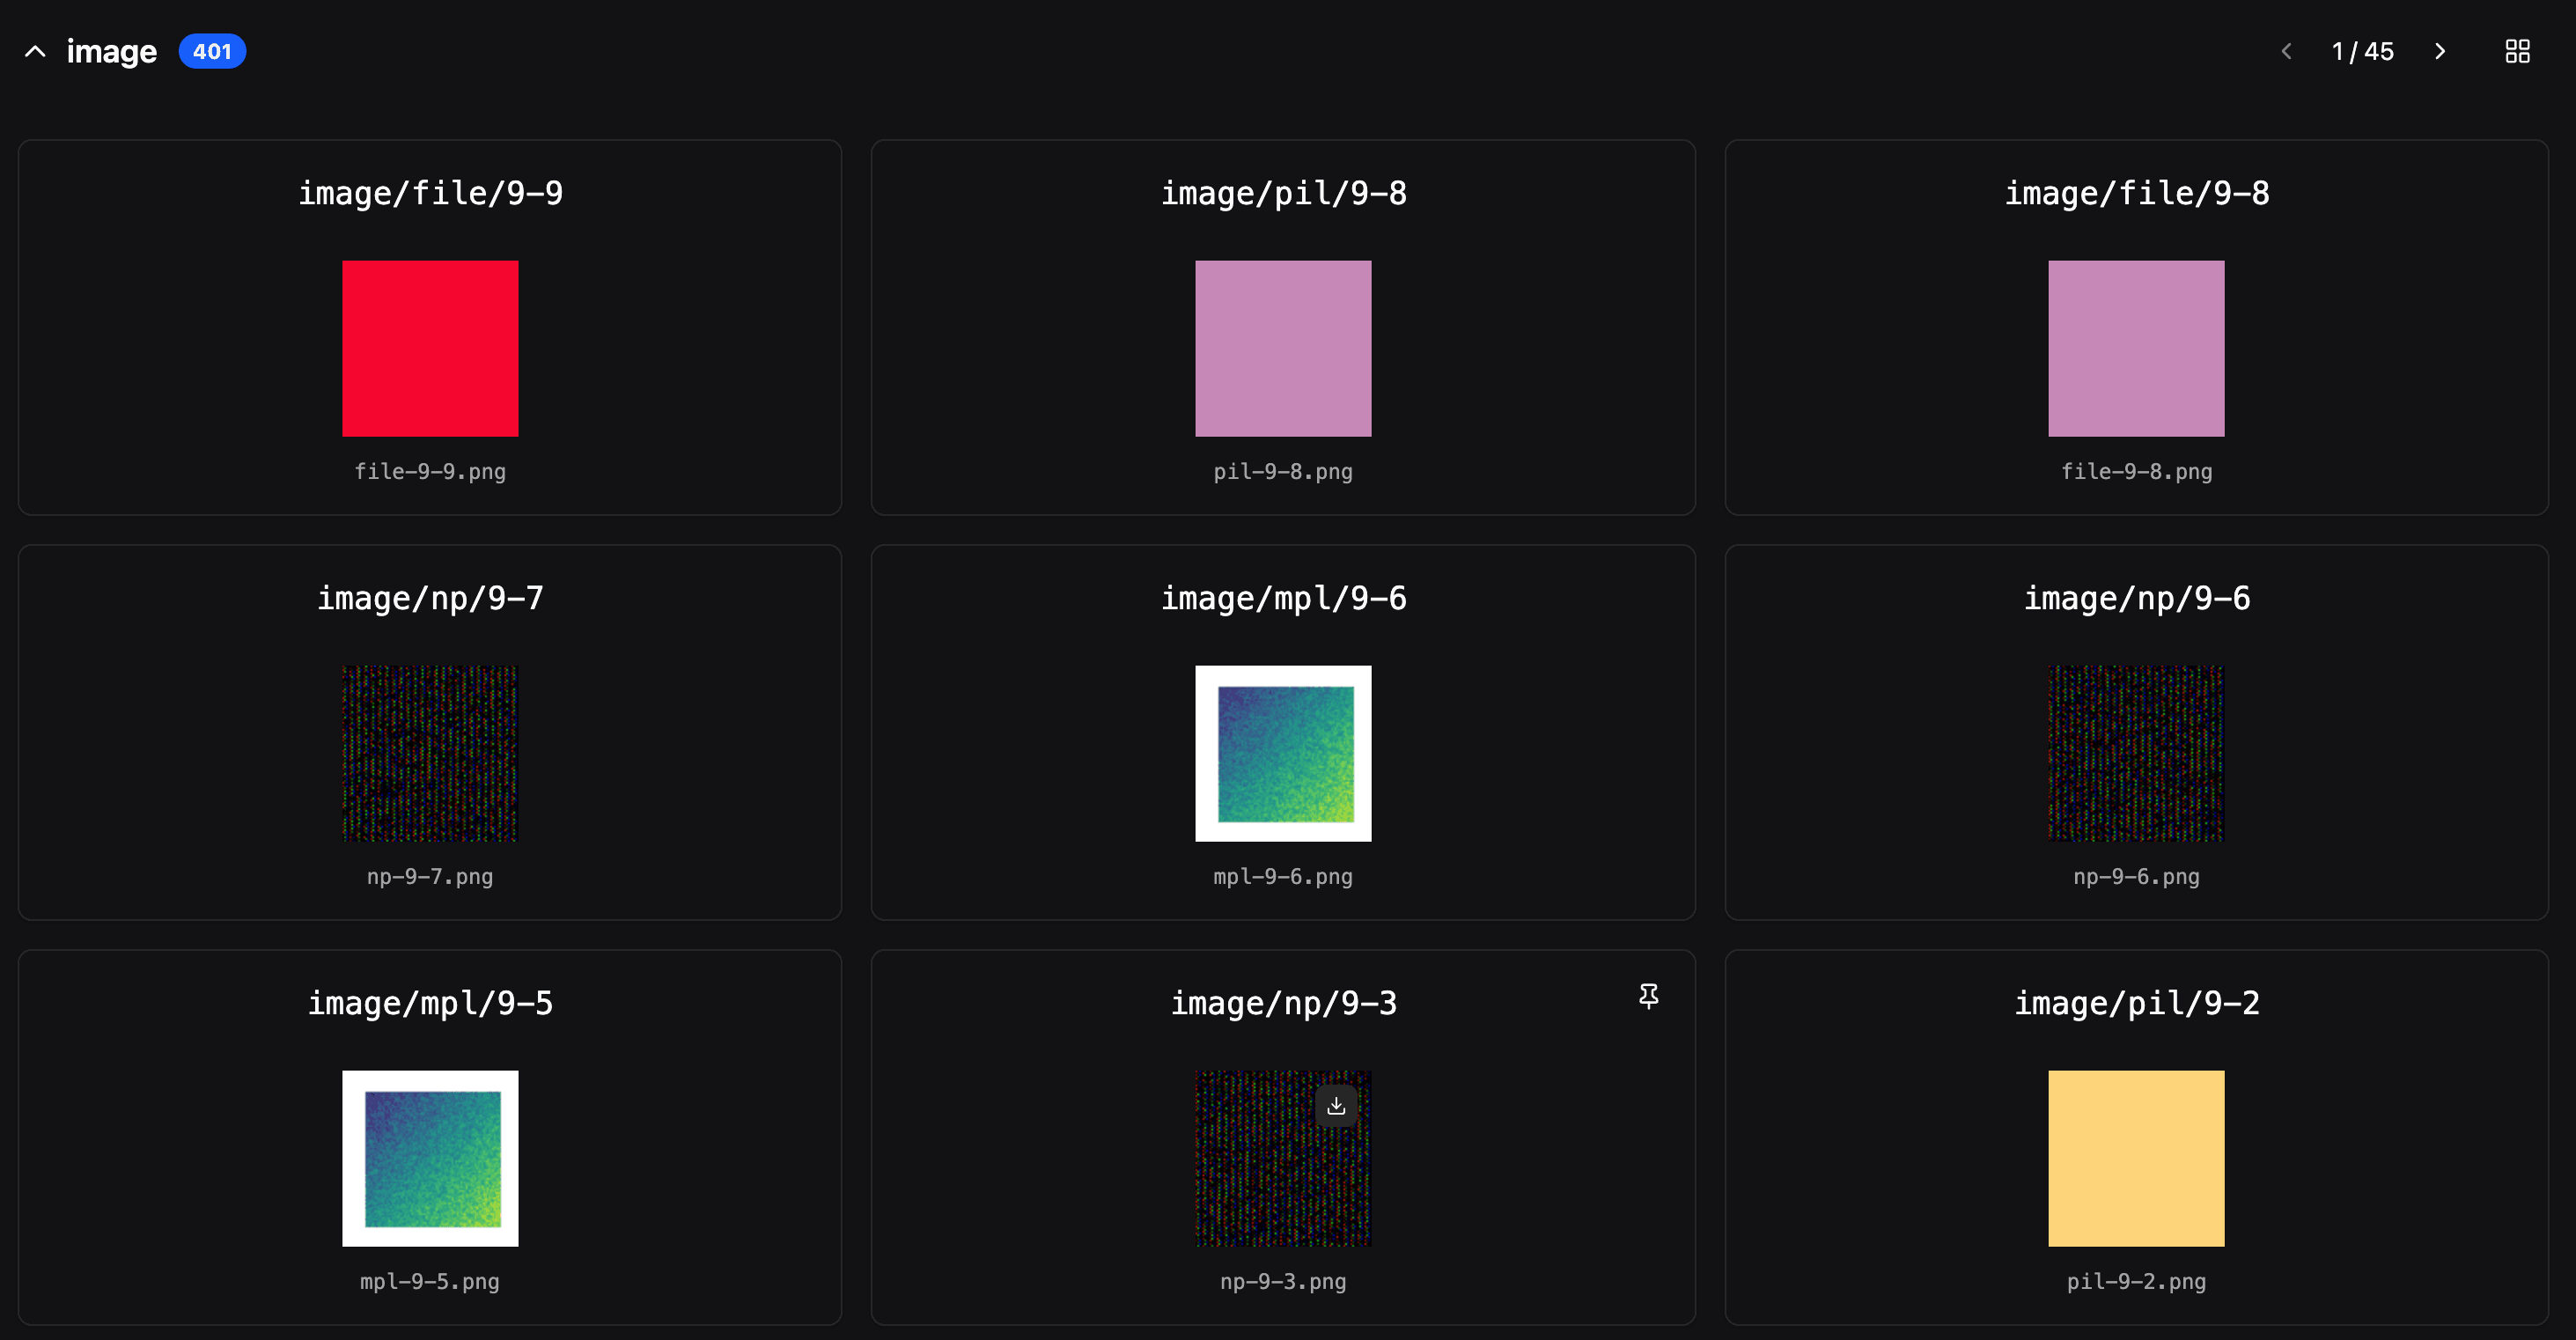
mlop supports logging many different image types to the platform, you can currently log images that are of the format of:
- NumPy arrays
- PIL/Pillow images
- PyTorch tensors
- Matplotlib plots or figures
To use image logging you first need to instantiate the mlop.Image class
| Parameter | Type | Description |
|---|---|---|
data | Union[str, PILImage.Image, matplotlib.figure.Figure, torch.Tensor, np.ndarray] | The image data to log. Can be a path to an image file, a PIL image, a Matplotlib figure, a PyTorch tensor, or a NumPy array. |
caption | str | A caption for the image. |
Supported Formats
mlop uses pillow as its backend for image logging, with the following supported formats.
Examples
Logging from PIL Images
Logging from File Paths
Logging from NumPy Arrays
Logging from Matplotlib Figures
This provides you with the nice visualization